Understanding variation in vaccination decisions across people and places in the Netherlands.
Vaccination uptake is shaped by more than information alone. People differ in how they weigh disease risk, vaccine benefits, social expectations, autonomy, trust, and practical confidence. This project connects detailed vaccination decision profiles with broader mapped profile groups that can support local pandemic preparedness.
Please note: the results shown here are provisional and may change as the analyses and mapped estimates are updated.
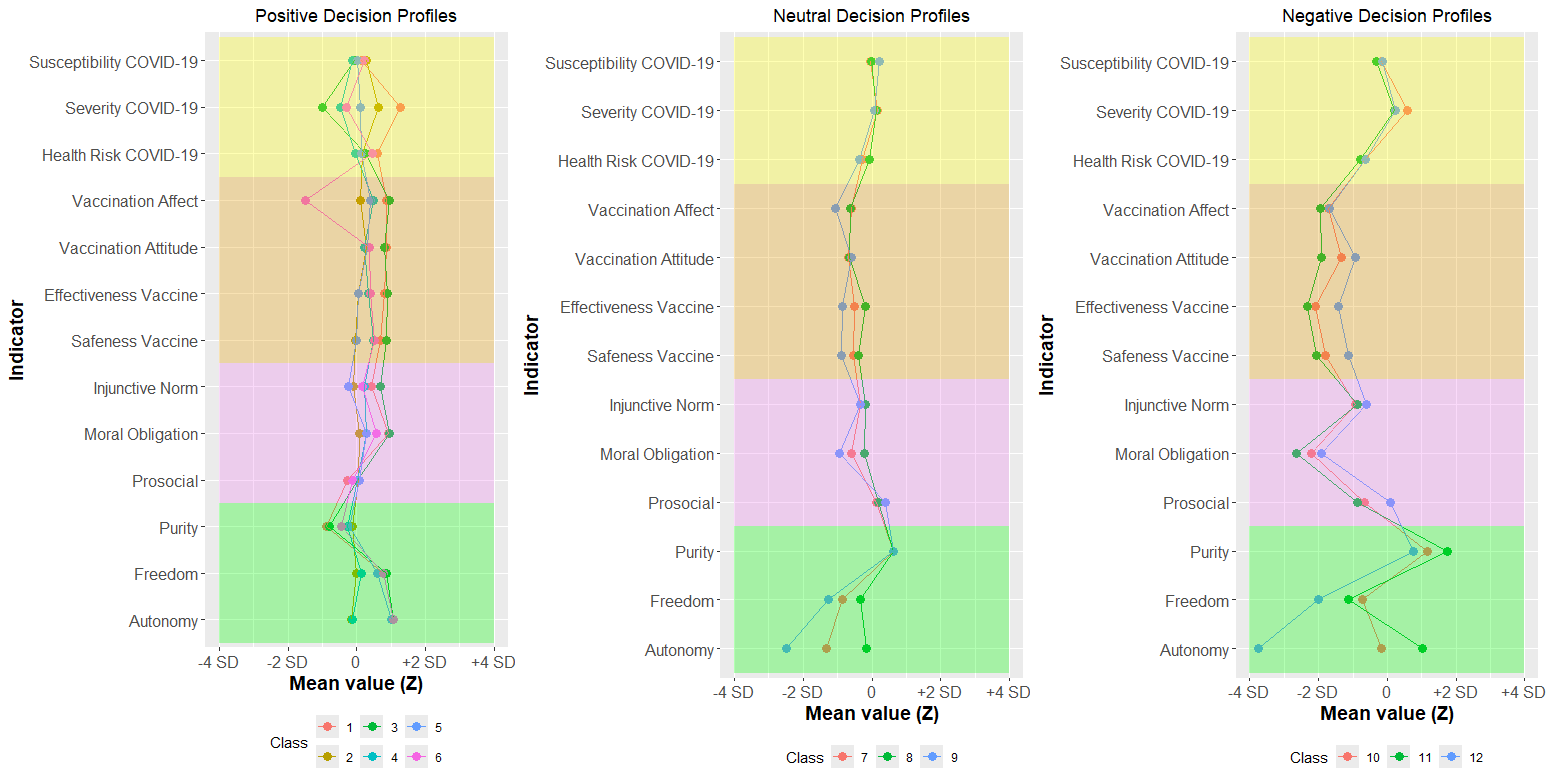
The first paper uses latent profile analysis in a representative Dutch LISS sample to identify 12 COVID-19 vaccination decision profiles. These are population patterns, not labels for individual people. The 12-profile solution preserves psychological nuance, showing why people with similar intentions may still need different kinds of communication and support.
Positive profiles 1-6
These profiles generally support vaccination, but not all for the same reasons. Some combine positive vaccine beliefs with strong moral obligation and social norms; others are positive while still showing more mixed feelings about vaccination.
Neutral profiles 7-9
These profiles sit closer to the middle on intention. They differ less by disease beliefs and more by vaccine beliefs, autonomy, freedom, and moral obligation.
Negative profiles 10-12
These smaller profiles have lower vaccination intention. They differ most in vaccine beliefs and individual values such as autonomy, freedom, naturalness, and purity concerns.
Profile share and intention to vaccinate
Each card shows the profile's share of the study population and the percentage who intended to vaccinate in July 2021. The fill colour tracks intention to vaccinate from lower red to higher blue. The left edge marks the profile family.
Lower intention to vaccinate (red) to higher intention (blue)Positive profilesNeutral profilesNegative profiles
Positive
P1
Share of population
6.9%
Intention to vaccinate
93.1%
Strong positive beliefs and a clear moral or social pro-vaccination signal.
Positive
P2
Share of population
11.1%
Intention to vaccinate
84.6%
Generally accepting, with a more mixed or less decisive profile than the strongest positive groups.
Positive
P3
Share of population
12.8%
Intention to vaccinate
94.2%
Consistently positive vaccine beliefs, social norms, and perceived benefits.
Positive
P4
Share of population
24.0%
Intention to vaccinate
88.6%
Largest profile; broadly accepting with moderately strong positive beliefs.
Positive
P5
Share of population
9.4%
Intention to vaccinate
81.7%
Positive overall, but with more room for practical questions or ambivalent feelings.
Positive
P6
Share of population
1.9%
Intention to vaccinate
92.0%
Small high-intention profile.
Neutral
P7
Share of population
11.6%
Intention to vaccinate
60.9%
Middle intention; support may depend on reducing uncertainty and clarifying benefits.
Neutral
P8
Share of population
11.6%
Intention to vaccinate
67.7%
Neutral but somewhat more inclined toward vaccination than the other neutral profiles.
Neutral
P9
Share of population
3.4%
Intention to vaccinate
49.7%
More hesitant neutral profile where autonomy and freedom may weigh more strongly.
Negative
P10
Share of population
2.7%
Intention to vaccinate
19.5%
Low intention profile.
Negative
P11
Share of population
3.4%
Intention to vaccinate
15.2%
Lowest intention profile.
Negative
P12
Share of population
1.2%
Intention to vaccinate
37.7%
Small negative profile.
Open the manuscript profile plots and exact Table 2 valuesFigure 1 from the current manuscript. Mean indicator values are shown as standardized scores. Profiles 1-6 are positive, profiles 7-9 are neutral, and profiles 10-12 are negative vaccination decision profiles.
Profile
Group
N
%
Intention to vaccinate, Jan 2021
Intention to vaccinate, Jul 2021
1
Positive
178
6.9%
89.07
93.11
2
Positive
287
11.1%
72.57
84.64
3
Positive
331
12.8%
87.95
94.23
4
Positive
621
24.0%
81.65
88.64
5
Positive
242
9.4%
70.13
81.72
6
Positive
48
1.9%
83.29
91.96
7
Neutral
300
11.6%
46.19
60.90
8
Neutral
299
11.6%
52.86
67.69
9
Neutral
89
3.4%
33.16
49.70
10
Negative
71
2.7%
11.80
19.48
11
Negative
88
3.4%
5.23
15.24
12
Negative
31
1.2%
27.90
37.71
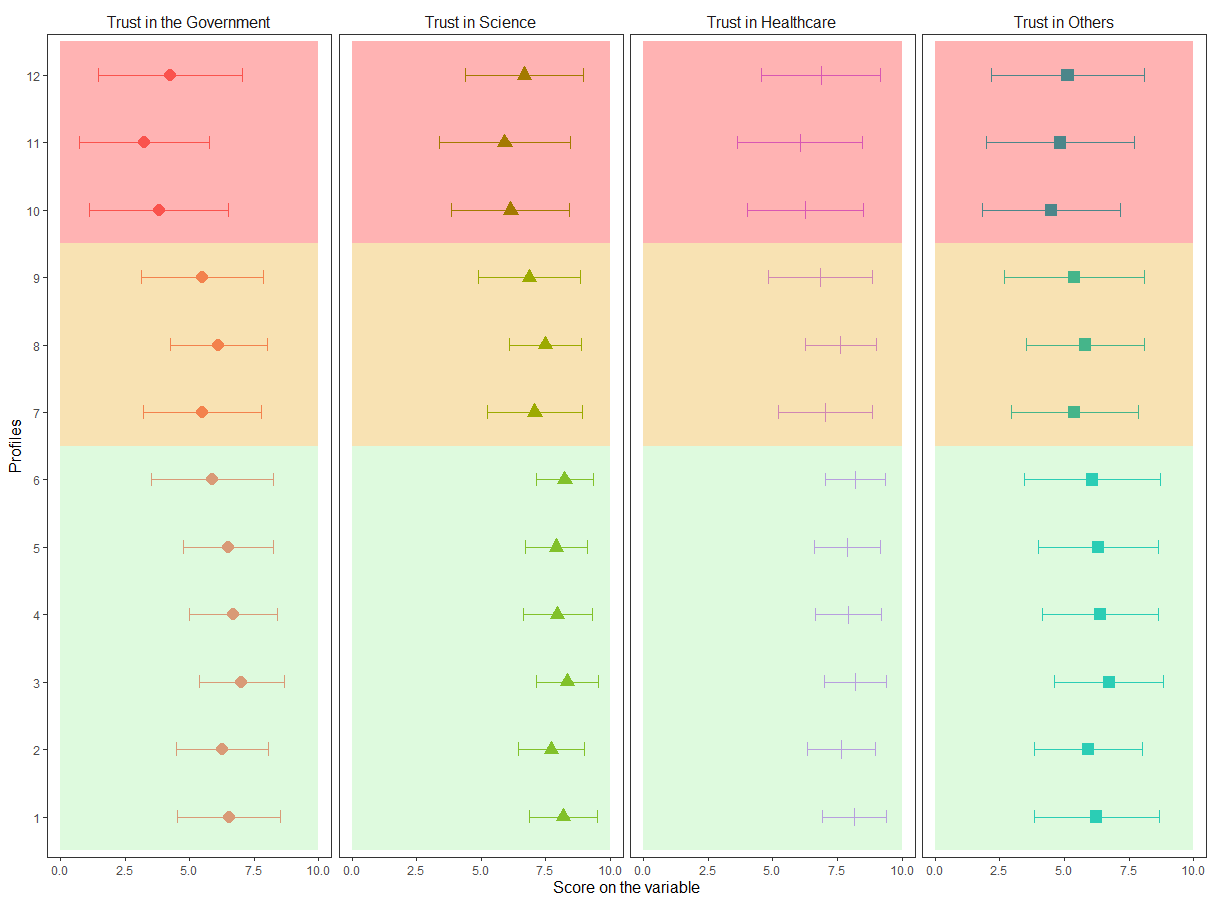
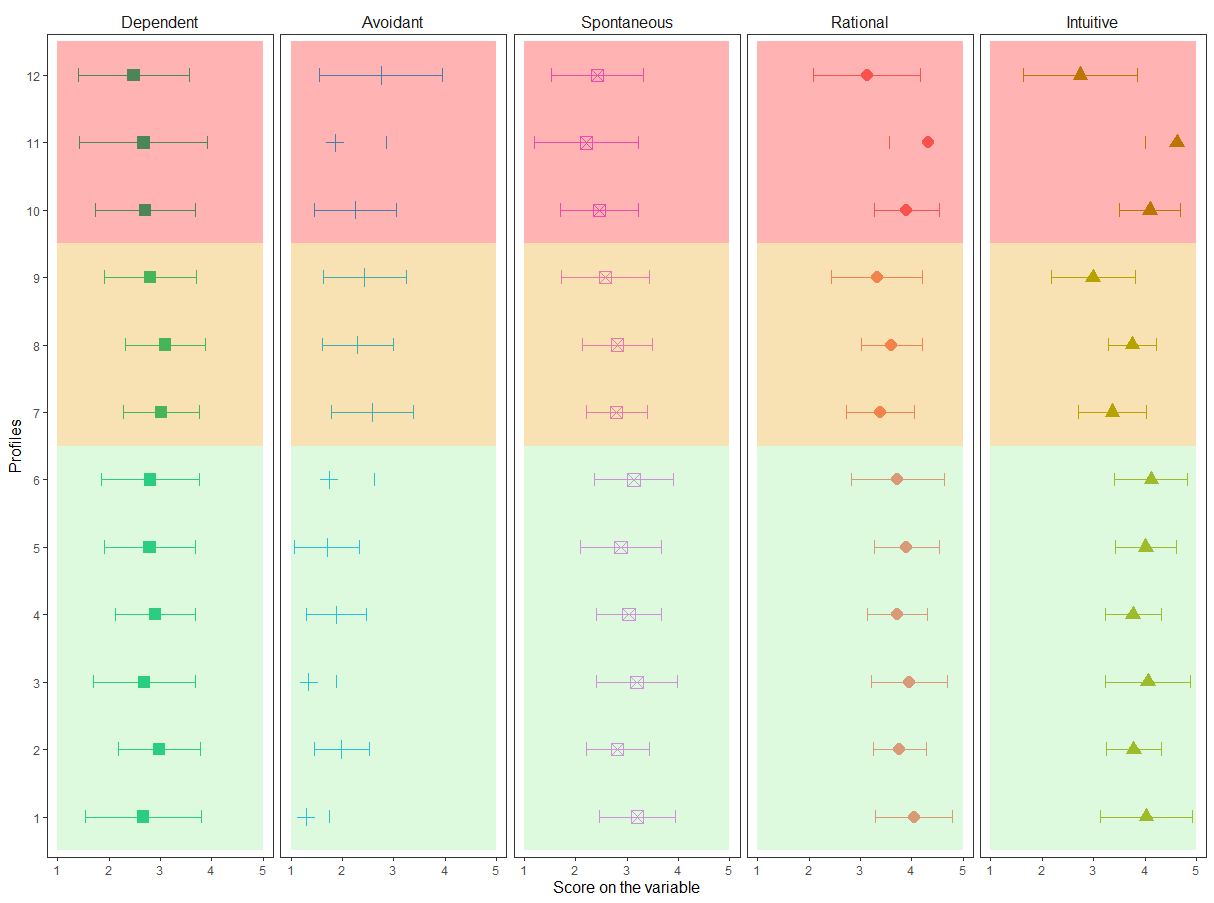
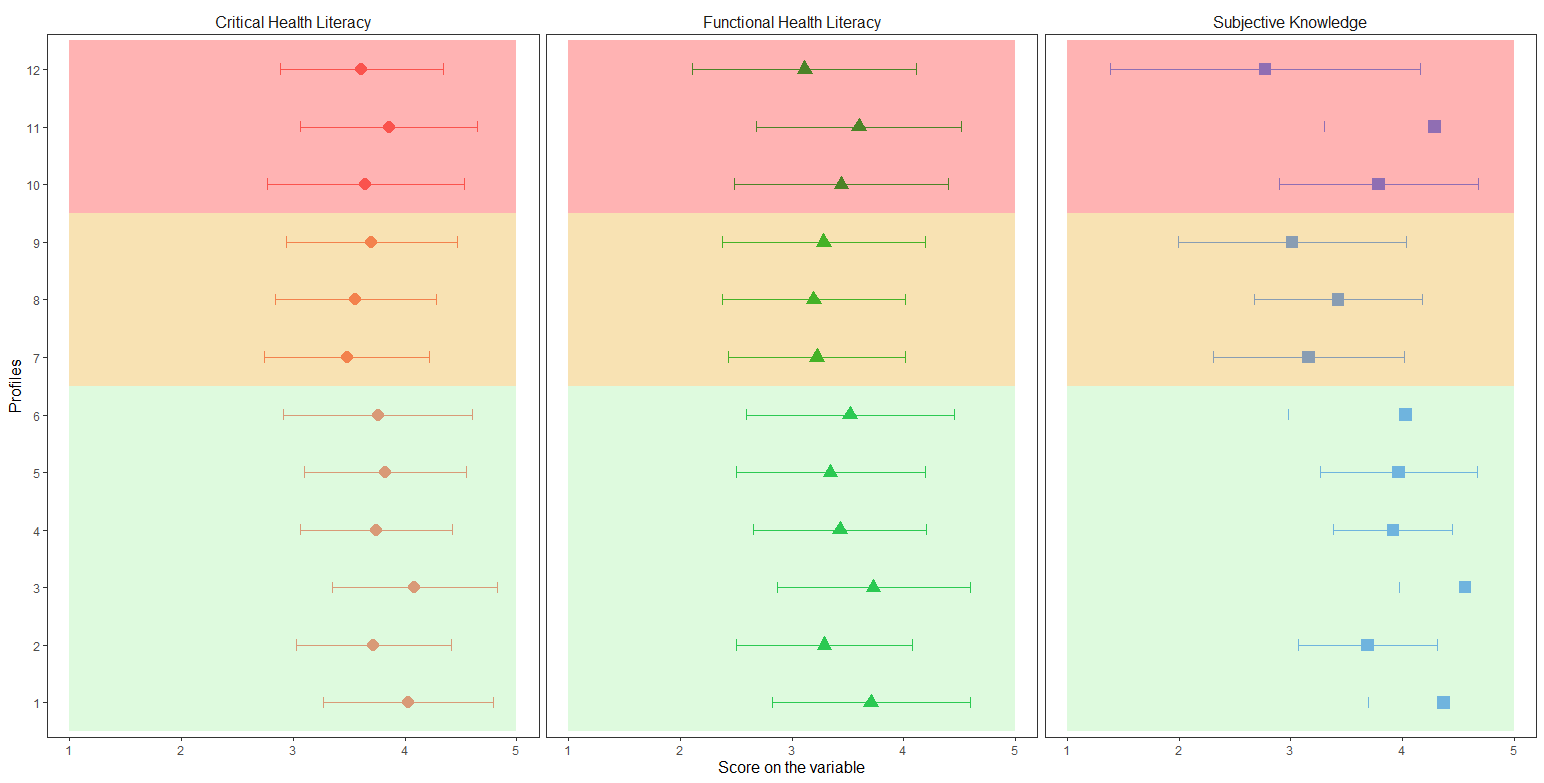
What else differentiates the 12 profiles?
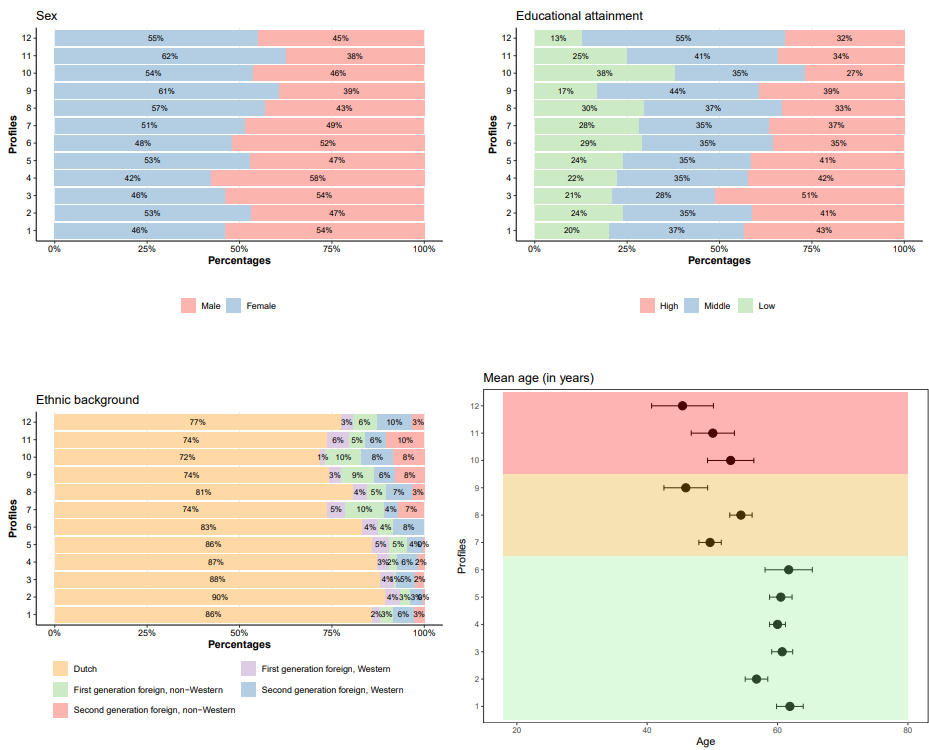
Trust is generally higher in positive profiles than in neutral and negative profiles.Negative and neutral profiles differ in avoidant and functional decision-making styles.Health literacy is not the whole story; subjective knowledge varies more clearly.Profiles also differ in demographic composition, which matters for interpretation and targeting.
Study 2
Mapping vaccination profile groups across Dutch regions
The map shows five broad profile groups across Dutch geographic areas. These groups combine the twelve vaccination decision profiles from Study 1 into three positive groups, one neutral group, and one negative group. The five-group solution is a modelling compromise: it preserves less psychological detail than the 12-profile survey solution, but it is a more reliable basis for mapping with registry data.
Three positive mapped groups
Placeholder to be described when the final Study 2 group labels are fixed. These groups combine profiles with generally positive vaccination intentions.
One neutral mapped group
Placeholder to be described. This group represents more mixed intentions and beliefs that may be sensitive to context.
One negative mapped group
Placeholder to be described. This group combines profiles with lower vaccination intention and stronger concerns about vaccination.
How to read the Study 2 map
The Study 2 map shows CBS-linked aggregate estimates by geography and selected demographic filters. Values are percentages at aggregate level. Cells suppressed under CBS output rules, or regions without data for a selected filter combination, are shown in grey.
What this means for vaccination practice and research
Diagnose why uptake differs
The profiles help separate belief patterns that may look similar in uptake statistics. Lower intention can reflect different needs, such as trust-building, autonomy-sensitive communication, or practical access support.
Match communication to decision patterns
Positive, neutral, and negative profiles differ in vaccine beliefs, social values, moral obligation, and trust. A single information message is therefore unlikely to fit all audiences equally well.
Maps are preparation tools, not labels
The wijk map is an aggregate planning tool. It can guide questions, partnerships, and resource allocation, but it should not be used to infer the profile or motives of individual residents.
The project is funded by ZonMw through the Kennisprogramma Pandemische Paraatheid. It develops modelling tools to estimate the distribution of vaccination decision profiles at population and local levels, with the aim of informing more targeted vaccination interventions.
Funder
ZonMw
Grant
10710062310013
Programme
Kennisprogramma Pandemische Paraatheid
Project title
Het modelleren van vaccinatie keuze profielen van burgers voor doelgerichtere interventies
Outputs
Paper 1:
How did people make COVID-19 vaccination decisions? A latent-profile modelling approach. Manuscript in preparation.
Paper 2:
Modelling the distribution of COVID-19 vaccination decision profiles in the Netherlands using CBS registry data. Manuscript in preparation.
Map explorer:
Interactive wijk-level map of five broader vaccination profile groups.